by David Auton, Senior Director of Reliability Engineering
This paper focuses on how an organization can determine their opportunity to improve, how they can determine when process improvement is capable of meeting the demand versus when technology is required, and the use of simple tools and basic process understanding to develop a work completion improvement strategy.
All organizations face cost and performance challenges when trying to remain competitive. Additionally, organizations want to achieve performance improvements and demonstrate good stewardship of their facilities. The reality is that maintenance activity has process-based components that can be readily assessed to determine the potential performance within the existing structures. This presentation helps leaders understand how basic awareness of process capability and simple measures can be applied to current processes and can be used to identify improvement opportunities. Approaches to determine what actions may be necessary to achieve improvements are reviewed with examples. Methods to estimate the impact of process improvements, technology, and tools are reviewed. Using a pragmatic approach, organizations can quickly determine whether a change in process or the application of technology investments are warranted and reasonable.
Objective 1: All human activity involves processes. Exercises are presented to demonstrate process in an organization. Common concerns: hidden factories, different paths, and anarchy. Organizations must determine the current process and compare to the “correct” process that should be followed.
Objective 2: Quantification is key. Pragmatic methods to measure processes. Sometimes generalizations get you close enough to see the fundamental problems.
Objective 3: All processes have an inherent capability. Demonstrate how to estimate that capability of a process (the Entitlement).
Objective 4: Determining the process capability is necessary before the benefit of added technology can be calculated. How to evaluate current process improvement programs and determine when technology is required to achieve a target capability.
- Using the basic metrics of Lead Time = WIP/Avg. cycle time (Little’s Law), we can see the process “high Level” capability and form a logical approach. Understanding work in process (WIP) and average cycle time enables discussion of lead time and process stability.
- Manual process steps typically achieve less than 99% accuracy (a step completed correctly every time). Processes containing multiple sequential steps suffer from the degrading rolled throughput yield (RTY).
- Improving process quality requires an understanding of the cause of the underlying poor quality. Is your current process adequate to meet the assigned demand?
- Following a standardized approach, process capability can be improved.
- Where process detail is not available, the “Black Box” approach using SIPOC or similar is often sufficient to begin an improvement program.
- Achieving world class Reliability Centered Maintenance (RCM) performance levels typically requires high data accuracy, but many improvements can be realized without waiting for the “data solution” to be perfected.
It is first appropriate to set the foundation with the definitions used in this paper. We will be considering three key components of a process. These are the process capability, the process entitlement, and technology as it applies to a process.
Process capability is the measure of a given process’ current ability to work. This is best described as the ability of the process to meet the needs of the organization. It should be noted the process capability is not the ability of any single process step or of the individual operator within the process. Process capability is often measured by historical performance and uses this historical performance to predict future ability to meet demand.
Entitlement is a calculation of how well the process could perform under ideal conditions. Consider the organization’s best performance when “in control.” The reason we want to understand the entitlement is to identify where improvements can occur (or where weaknesses exist). This also helps us set reasonable goals for improvement.
Technology is the application of tools or automation to a process to execute work faster and, hopefully, with more accuracy. If we use technology to automate the underlying process, we need to ensure it supports the entitlement so that capability is improved and that it’s not just a mechanism to create more defects faster.
To put this in a visual context that may be easier to understand, consider an auto race. We could identify the technology as the car you drive. Capability is the road you are driving on. Entitlement is how fast you can take the next corner (and stay on the track). This is a simplistic reference but adequate for our discussion.
All human activity involves processes. Each activity has a beginning step and a concluding step. This is the same with maintenance execution. When evaluating the maintenance process, consider some of the common discoveries that impact process capability. Until a process is actually documented, many steps are not evident or not understood. An example of a typical discovery in this activity are hidden factories. This is a set of steps performed with no clear demonstrated value. Often times, additional steps are added to a process or teams of people perform actions to “clean up” mistakes made previously. These are referred to as hidden factories because they can consume enormous resource with no clearly defined product. Some examples of hidden factories include:
- A planning team required to track down the parts needed for a preventive maintenance (PM) instead of having the correct bill of materials included in the PM description and ordered automatically through the MRO program.
- A data quality team that corrects data errors for in-process work instead of correcting the process to prevent the generation of data errors.
- Multiple approvers required in a process instead of well-defined authority levels that minimize escalations.
Different process paths or inconsistent execution of work can occur when acceptable outcomes are not defined. If the users are not trained on standard work, the results of comparable work can produce significantly different results. Maintenance processes need to be a standard set of steps that all participants perform comparably. If two people execute the same activity but get different results, there are likely subjective process steps that should be corrected.
Anarchy results from differing process paths where no clear guidance or adherence to standard work exists. Anarchy is typically exemplified by no clear rank or prioritization of work. In such cases, two extreme scenarios often develop:
- Because there is no clear priority, technicians “cherry-pick” the work they prefer to do, leaving undesirable work to be delayed or never completed.
- Technicians are overloaded and expected to “do it all” and “do it now,” and they simply do not have the bandwidth to keep up with the demand.
One should be very aware that complexity in the process creates opportunity to fail your customer. The objective should be to reduce complexity where possible. This begins with understanding your process. One of the first steps in understanding your process is to produce the documented process. Most teams feel they understand their process until challenged with critical questions. Can you produce the agreed process in a documented procedure guide? Does each member agree that it is accurate? A good exercise is to pick one team member and give them a black marker to draw the process on the board without interruption from other team members. Next, give a second team member a red marker and ask them to correct the mistakes, again without interruption from other members. When they finish, pick a third member, give them a different marker color, and repeat the exercise. After three or more members make their “corrections’ it becomes evident to all members just how well they understand the process.
As stated earlier, all human activity involves processes. Humans are also creatures of habit. We play golf on Saturday, do our grocery shopping on Sunday, we have “laundry day” etc. This has a larger than expected impact on how well our processes are executed. When looking for common failure points in a process, be aware of this “habit” phenomena. Patterns in the data where failures occur on a rhythmic scale will likely point to some type of corporate habit. Consider standing work orders that get closed each month as an example.
Before moving off this topic, it is relevant to understand that there are three versions of every process. There is the “what we think it is’ version that comes out in the white board exercise described above. This is the team’s understanding of what typically occurs in normal working conditions. The team exercise is not likely to capture abnormal events, as team members determine what is “normal.” A second version of the process is what actually happens with all the special circumstances and un-anticipated interruptions. This is best understood by following a transaction through the process and documenting each step. Value-stream mapping (VSM) and the “Gemba Walk” are methods to understand what actually happens. The third version of a process is what we would like the process to be. It is our interpretation of the ideal process. This third version is most often the least complex version and the version we strive to achieve.
It is important to understand the three versions of every process in order to understand what to measure. As stated by Deming, we cannot know if we are improving unless we have the ability to measure. Understanding the three versions of a process enables us to select the correct measurement and enables us to evaluate if improvements occur. It is essential to understand that what you are measuring is a part of the actual process.
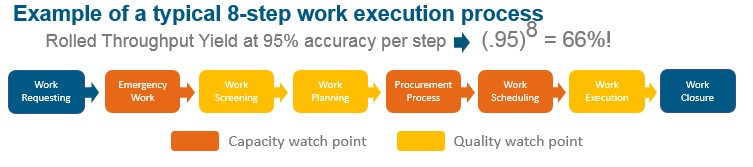
Two primary measurements for process improvement are the yield quality and the cycle time. Yield quality is a reflection of how many transactions get through the process in good condition. Rolled Throughput Yield (RTY) is a measure of how many transactions survive a sequence of process steps and remain in “good standing” for quality. When looking at a sequence of steps, the error rates accumulate to the point that small error rates per individual step can become a higher error rate when considering the entire process. As an example, a typical work execution process with 8 primary steps having 95% accuracy per step (a very typical rate for manual steps) degrades to only 66% likelihood that a single transaction will survive with adequate quality. RTY is important to consider because it provides an assessment of the end-to-end process quality.
We could say yield quality is a measure of transactions executed “without defect,” but transactions can often succeed with some of the details out of place. For example, a work order can be executed to the service requirements and still be missing pieces of data like the equipment number, the problem code, or other elements. Be aware that data quality metrics, sometimes referred to as defects per unit (DPU) metrics, may be a client KPI but have little influence on the technical team’s ability to meet the client demand (unless they become a hidden factory).
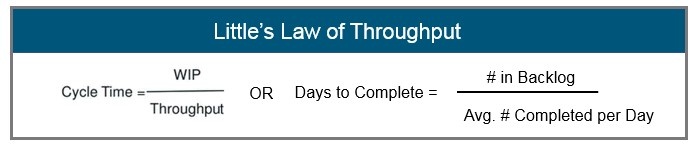
A second key measure of your process is the average cycle time. A sequential process is similar to a chain. As a chain is only as strong as the weakest link, a process cannot move faster than the slowest step. There is much literature and research on calculating task time, cycle time, and process speed, but for a service process this can be simplified to the average cycle time. Little’s Law is a very useful tool and is easy to apply for work order capability assessments. Little’s Law states that the average cycle time is a ratio of the total amount of work divided by the speed that work is completed. The equation is pictured below and we will get into how to apply in the next section.
Determining the capability of a process or a team can be a challenge. Many reasons exist to challenge our ability to measure, but these can all be addressed with effort. It is important to verify the measurement is capable of meeting the need. Many teams fail to remember that the effort should be applied to the solution, not the measurement system. A typical hidden factory exists when several hours, a week, or, in some cases, several team members are dedicated to measuring the process. A simple rule to keep in mind is “Measuring should never be harder than fixing! ? In other words, if measuring is going to take more effort than fixing what is likely wrong, just put the effort into fixing what is likely wrong.
This is not to say that “shotgun” approaches are sufficient, but most teams have limited resources and consuming them on measuring may not be the best use of their time, especially if the problems are evident without precise measurement. Some very basic guidelines for measuring a process include:
- Don’t make the measurement more work than the most likely solutions.
- Begin with pragmatic methods to measure processes. Sometimes generalizations get you close enough to see the problems.
- Make sure you are measuring the right thing: direct vs. indirect, leading vs. lagging, etc.
- The ideal solution is an automated calculation generated from the raw data.
- In the worst case, a survey or estimating can be effective to get a baseline.
Some additional notes to consider: prevent gaming the measuring system. People are creative and if given a metric with a value that is “green,” they will tend to get a green value whether they did what was needed or not. It is worth mentioning again that hidden factories to measure or monitor will consume the teams’ capacity to do work! We cannot change what we cannot measure (Deming), but the measuring should not be more effort than the change.
Let’s begin the measurement with a challenge to the typical thinking in most circles; we only need the backlog and weekly completed work to determine the capability of the current process. The value of taking this “Black Box” approach is that we need not detail out every process step. We can consider the entire process as a black box that contains the “generic work process.” The big problems of RTY and Capability (Little’s Law) will reveal themselves at this level. From these high level results, additional improvement efforts can be more focused.
It is relevant to now discuss analysis of measurement system. Measurement system analysis is a mathematical method of determining the accuracy and precision of the system used to make the measurement. The measurement must reasonably identify the size of the problem and be capable of detecting changes from improvements. This is important as we must be able to trust the measurements observed.
Be aware that true RCM programs are implemented with ~95% data accuracy, but making fundamental improvements does not have to depend on such complex data programs. Using reasonably accurate data can be very effective. By reasonably accurate, we mean that we should be measuring at least 75% of the work effort. An example: for every 40 hours worked by a technician, at least 30 hours should be logged to a work order. Anything less and you could be chasing ghosts, thinking you are improving the team’s capability but not seeing the entire picture. Un-recorded activities are often the most explanative of reduced performance.
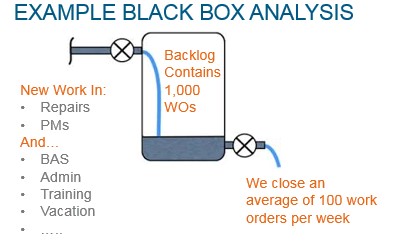
With a reasonable measure of the total backlog of work and the average completion rates, we can apply Little’s Law to the Black Box Analysis. Using a very simple example, let’s presume the following scenario:
Backlog of work is 1,000 work orders.
Average completion is 100 work orders each week.
Based on a “steady state” consideration of this example, there is approximately 10 weeks of work in the backlog and the “average time” to complete a new work order will be in about 10 weeks. Now consider if the team could keep up with demand. If all work must be completed in less than 90 days, it might be possible. If all work must be completed in less than 60 days, it would not be possible as some work would age beyond the 10 weeks (70 days), and the team could not meet demand.
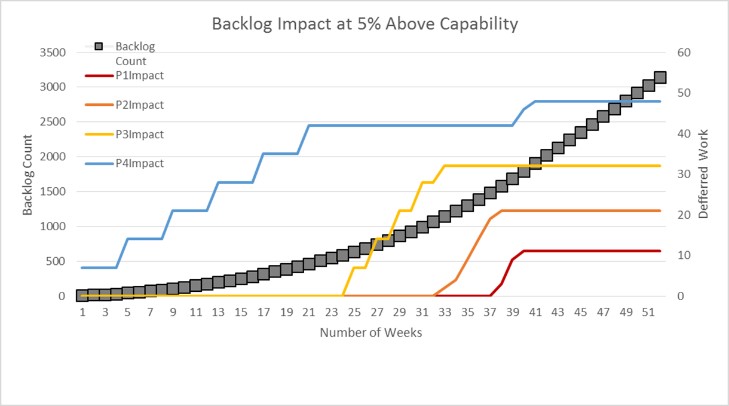
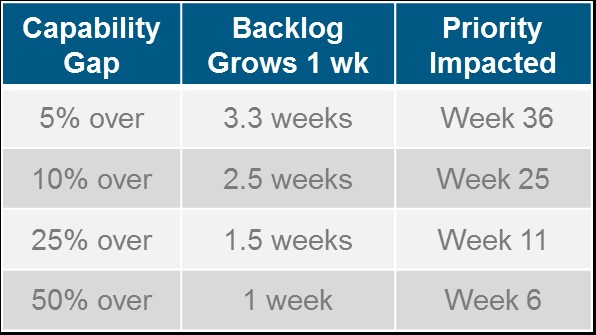
We can also run desktop simulations to consider the impact of capability. Below is a graphic representation of the work order backlog growth. The example simulates 150 work orders per week with a typical priority (P1-P4) mix.
At 5% over capability to deliver, the backlog increases 1 week for every 3.3 weeks. In 36 weeks, the aged work begins to impact even the highest priority work, meaning some work is totally abandoned.
OK, so we walked through some interesting examples and talked about basic process measurements, but how do we know what we should be measuring? Can we get into some real improvements using these measurement approaches? Fortunately, world-class workforce performance has been defined for maintenance organizations. Two primary measures can be used to evaluate process capability in regards to world class comparison.
The Society of Maintenance Reliability Professionals (SMRP) has developed a catalog of metrics and defined world-class performance levels. One measure related to process capability is the volume of work that breaks into the previously scheduled work plan. The “urgent” or “break-in-schedule” work should be no more than 10% of total work for a given week. Refer to the SMRP Best Practices Section 5.4.1 (Reactive Work) for more details.
A key measure of process work quality is the amount of work that is required to repair equipment versus to maintain (preventive). Several studies have been conducted and multiple sources exist with some variation, but all focus on the premise that good quality prevention will reduce the failure rates. The generic conclusion is that at least 75% of labor effort should be preventative. This is supported by the “IFMA Sustainability How to Professional Metrics Guide, 2015 Measurement and Monitoring Guide” where the actual process measure is PM to CM ratio in table 3: CMMS KPIs. This is also supported by “Maintenance and Best Practices,” Ramesh Gulati PP68: “Planned Maintenance, typically 40-70%, World Class is 85-90%.
A famous study by John Day Jr. proved the ?6 to 1 rule” at Alumax South Carolina where 6 PMs for every repair = ~83%. This study is based on the count of WOs, so this works well where CMMS data is available, but technician recorded labor is unavailable. There is also reference to the preventive work in SMRP Best Practices Section 5.4.2 (Proactive Work), although this proactive work includes restorative work discovered in preventive evaluations.
Now that we have discussed the process, process capability, and ways to measure, let’s consider some typical examples that you will likely see. Each of the below will be a graphic of the measured data and a short explanation.
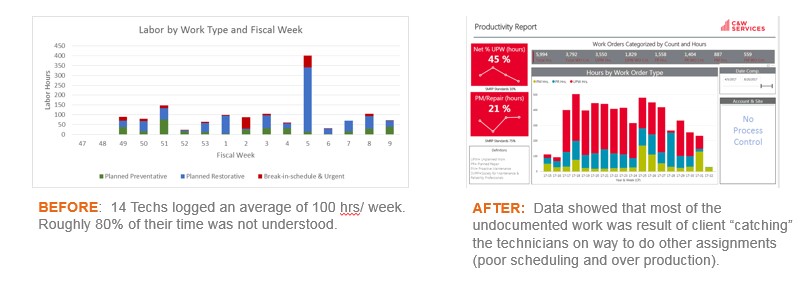
Example 1: Poor Measurement System
Below is the before and after example of a poor measurement system. Initially, the technicians were not recording their time against the completed work. After enforcing correct time recording in the CMMS, it became evident that the “capacity killer” was work interruptions. Adjusting the work assignment process to reduce the interruptions improved team capacity.
Example 2: Good (But Not World-Class) Performance
Below is a measurement of a well-performing team. This team consistently achieved 90% or better KPI ratings from their client for on-time completion of work. Note the cyclical behavior from standing work orders.
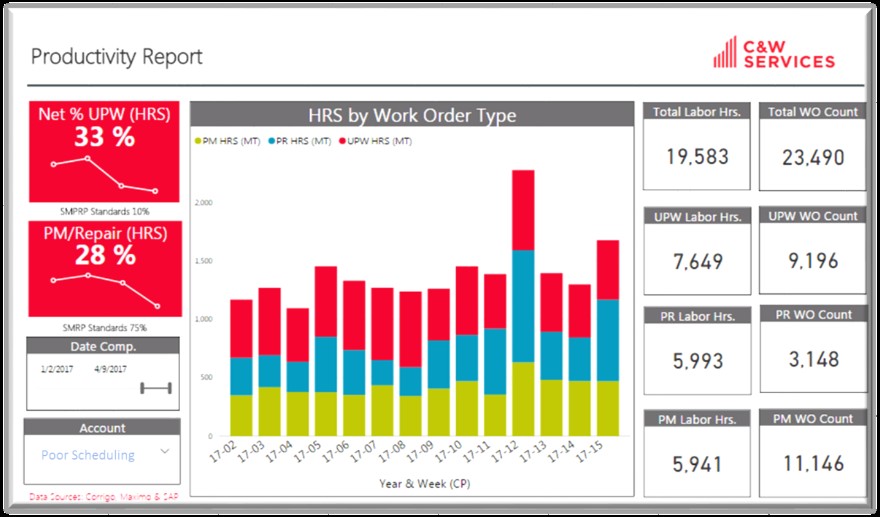
Example 3: No Scheduling Controls
Below is a measurement of a team that does not properly schedule work. This includes “cherry-picked” work and frequent interruptions.
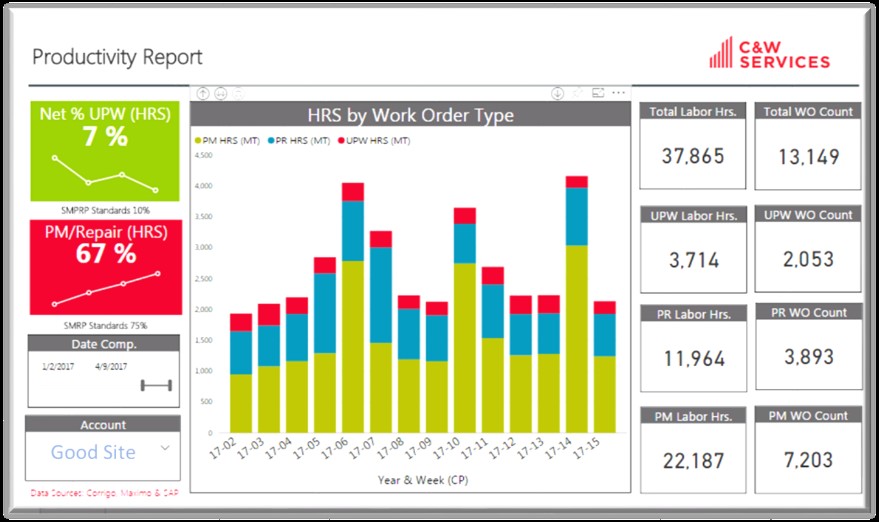
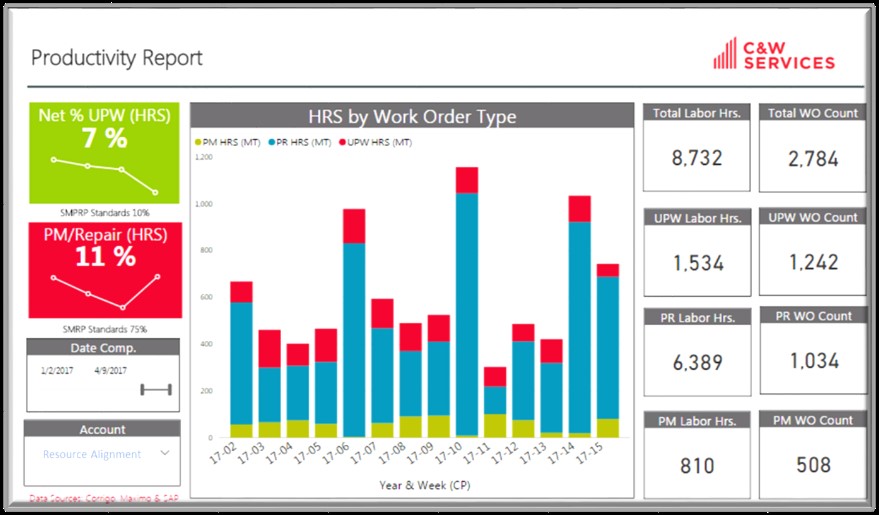
Example 4: Poor Work Quality and Resource Alignment
Note from the measurement that the majority of the work is not preventative. There are two reasons this would be the case. The preventive work is not effective and break downs are frequent, or the teams are not being assigned preventive work. For this particular client, the teams were being used for move, add, change (MAC) work. Such work may be acceptable, including set-up for monthly conferences (see the monthly work pattern). The challenge for this team was that many of the highly skilled tradesmen were being assigned MAC and conference set-up activity, a very inefficient use of the team capability.
As with any good effort, you need a plan. For process improvements, two approaches that work well are the Plan, Do, Check, Adjust (PDCA) system of continuous improvement and the SCRUM method of rapid prototyping. Either can work, but an approach should be agreed on by the team and followed for consistent progress toward the improvement goal. A short summary of each of these is provided below:
PDCA Approach:
- Plan — Use Pareto and FMEA to prioritize what to focus on first.
- Do — Execute RCA and other approaches to determine what action is needed.
- Check — Make sure you have a valid measurement system. The baseline and improvement measurements should use same methods.
- Adjust — Make changes to improve the capability. Small changes may be better than the big swings.
- Repeat this process until the capability goal is achieved.
SCRUM Approach:
- Plan — Propose an improvement that can be completely implemented within the agreed cycle time.
- Sprint — Implement the improvement completely on a small scale.
- Test — Did the team capability (or work quality) improve?
- Implement – Make the improvement part of the business as usual approach and maintain.
Improvement comes from effort and should not be a random event. Focused and deliberate improvement efforts will be beneficial. Remember that all the improvement need not occur immediately as most scenarios are steady-state and will remain unchanged unless change is introduced. Stay focused and trust the problem-solving approach to see positive results. By focused effort, process entitlement can be achieved.